
Remote Monitoring and Analytics
Sector: Digital health, remote patient monitoring
The scenario
Imagine you are building a remote monitoring service for patients with chronic heart failure. Your kit includes a Bluetooth scale, a pulse oximeter and a blood pressure cuff, each from a different vendor with its own SDK, cloud and data format. Next quarter a fourth device arrives, a glucose monitor.
Two things matter to you. The first is alerting: the most useful signals are the ones that happen together, like weight gain over two days plus a rising resting heart rate. The second is analytics: your clinical team, partners and investors will ask questions like "how did patients on this protocol do over six months?"
What goes wrong without the right tool
- Every vendor gets its own ingestion pipeline, its own table and its own alert rules, so each new device is a new project.
- Cross-device rules become custom code, because the readings live in different places with different timestamps and units.
- Every analytics question turns into a data-engineering request.
- Changing an alert threshold means a developer, a release and a regression risk.
- Nobody can easily answer "why did this patient get an alert on the 12th?", because readings and rules change over time.
How Atomik can be used
- Model the clinical facts, not the devices. Define openEHR templates for what you measure (body weight, blood pressure, oxygen saturation, blood glucose) and upload them to Atomik.
- Translate on the way in. One integration layer converts each vendor's payload into a composition of the right template and commits it to the patient's EHR through the REST API. A new device means a new mapping, not a new database.
- Write the alert rule once. In the Query Builder, create one query for "weight gain over 48 hours" and one for "rising heart rate", and combine them (Combined Queries, a premium feature) so they must hold for the same patient. Your application runs the query through the API and raises the alert.
- Let the clinical team own the thresholds. Queries are edited in the Web Console, so adjusting a threshold doesn't require a release.
- Reuse the same data for analytics. A cohort ("heart failure patients with weight gain above X") is another stored query over the same record, and results can feed your BI or visualization tools through the API.
- Keep the history. Data is versioned and audited, so you can reconstruct what a patient's record looked like when an alert fired.
How CaboLabs can help
Mapping each device's payload to the templates, and designing the API around it, is integration work that CaboLabs, the builder of Atomik, can help with: see API Design and openEHR Implementation. Atomik doesn't require CaboLabs services.
What this gives you
Adding a device becomes a mapping exercise. Alerts and analytics come from one data definition instead of several. The people who know the clinical rules can maintain them.
Why Atomik fits
Device data is only useful once it means the same thing regardless of who made the device. Atomik stores clinical facts in an open standard, so alerts, reports and future devices all work against the same definitions, and nothing is overwritten.
Going deeper
Are you building a physical activity monitor, sleep tracker, weight control app, or remote patient monitoring platform? Atomik acts as the canonical data aggregator backend — simplifying ingestion, standardizing storage, and powering automated alerts and recommendations through smart queries.
Architecture & Data Flows
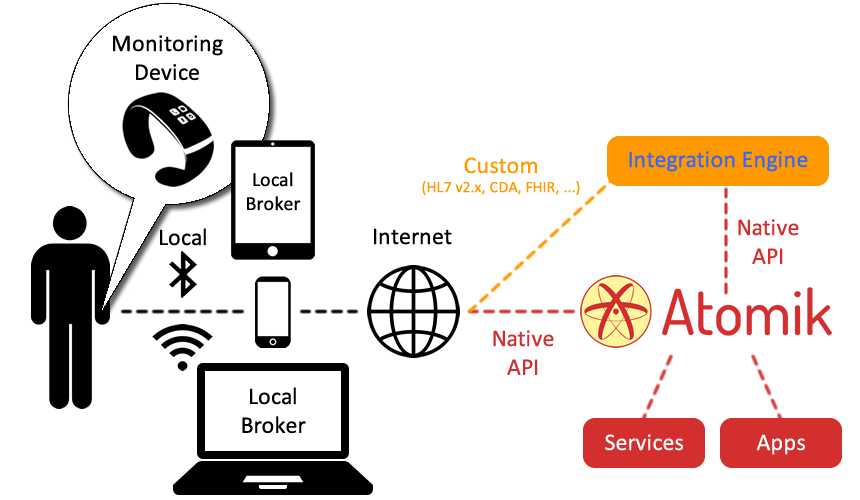
The most common architecture for monitoring devices include a physical monitor, that generates raw data from vital signs, analyzing chemicals, sleep status, exercise and other kinds of measurements. The monitoring device then communicates the raw data to a nearby device, which is commonly called "gateway". In general that communication happens through BLE (Bluetooth Low Energy) or similar PAN (Personal Area Network) protocol.
The gateway has connection to the Internet and can communicate the raw data, maybe pre-processed, to a cloud service. That could be a direct communication (Native API) or via a broker/integration engine. A broker would transform the data coming from the gateway into a format the cloud service can understand.
In this context, Atomik acts as the cloud service, where data is stored in a standardized format, and the goal of the broker is to transform raw or raw-processed data into openEHR data, since the Native API is openEHR-compliant.
The final piece of the puzzle is the data analysis and visualization. To support this, Atomik provides a visual Query Builder that allows users to create complex queries without programming skills, which can be executed via API calls. This allows to create any number of "data services", to access data in a standardized way, and feed any analytics or visualization solution.
The goal of Atomik is to sit in the middle of the data collection / processing, and how the final data will be used for analytics / visualization, simplifying data management and access in a standardized an vendor-neutral way.